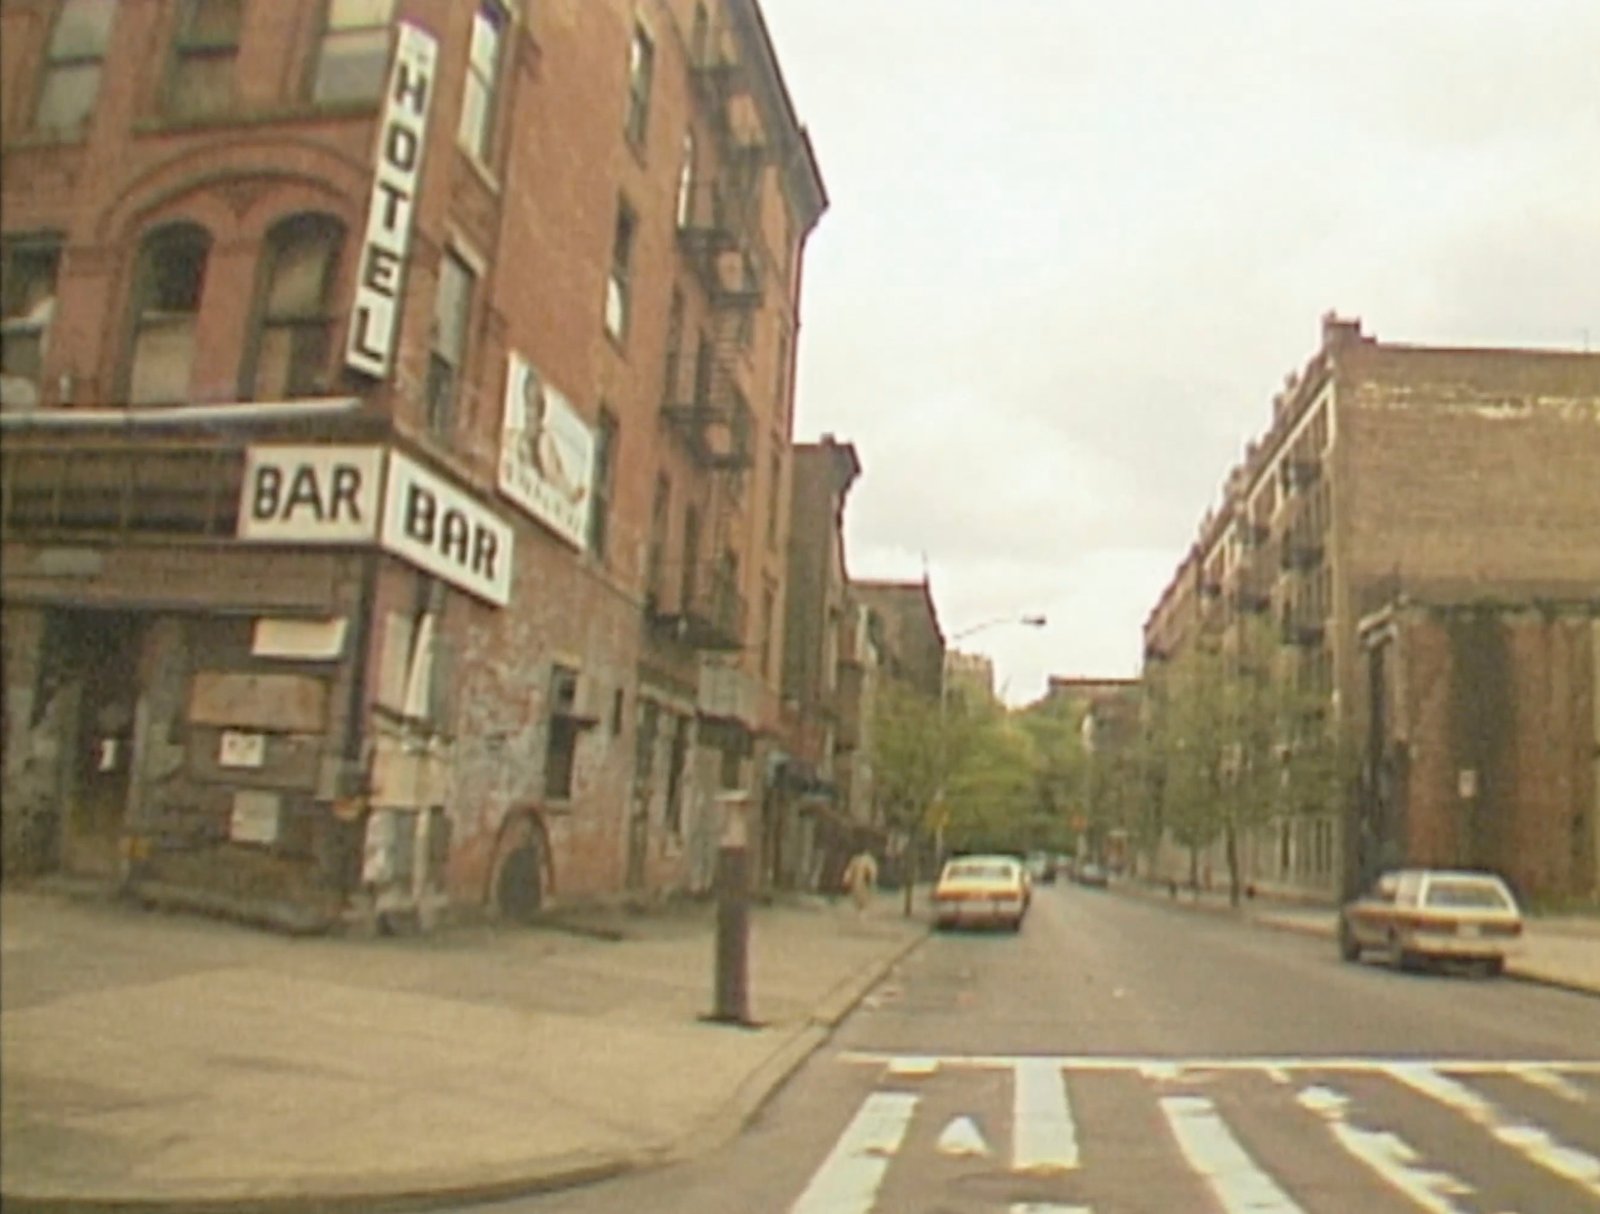
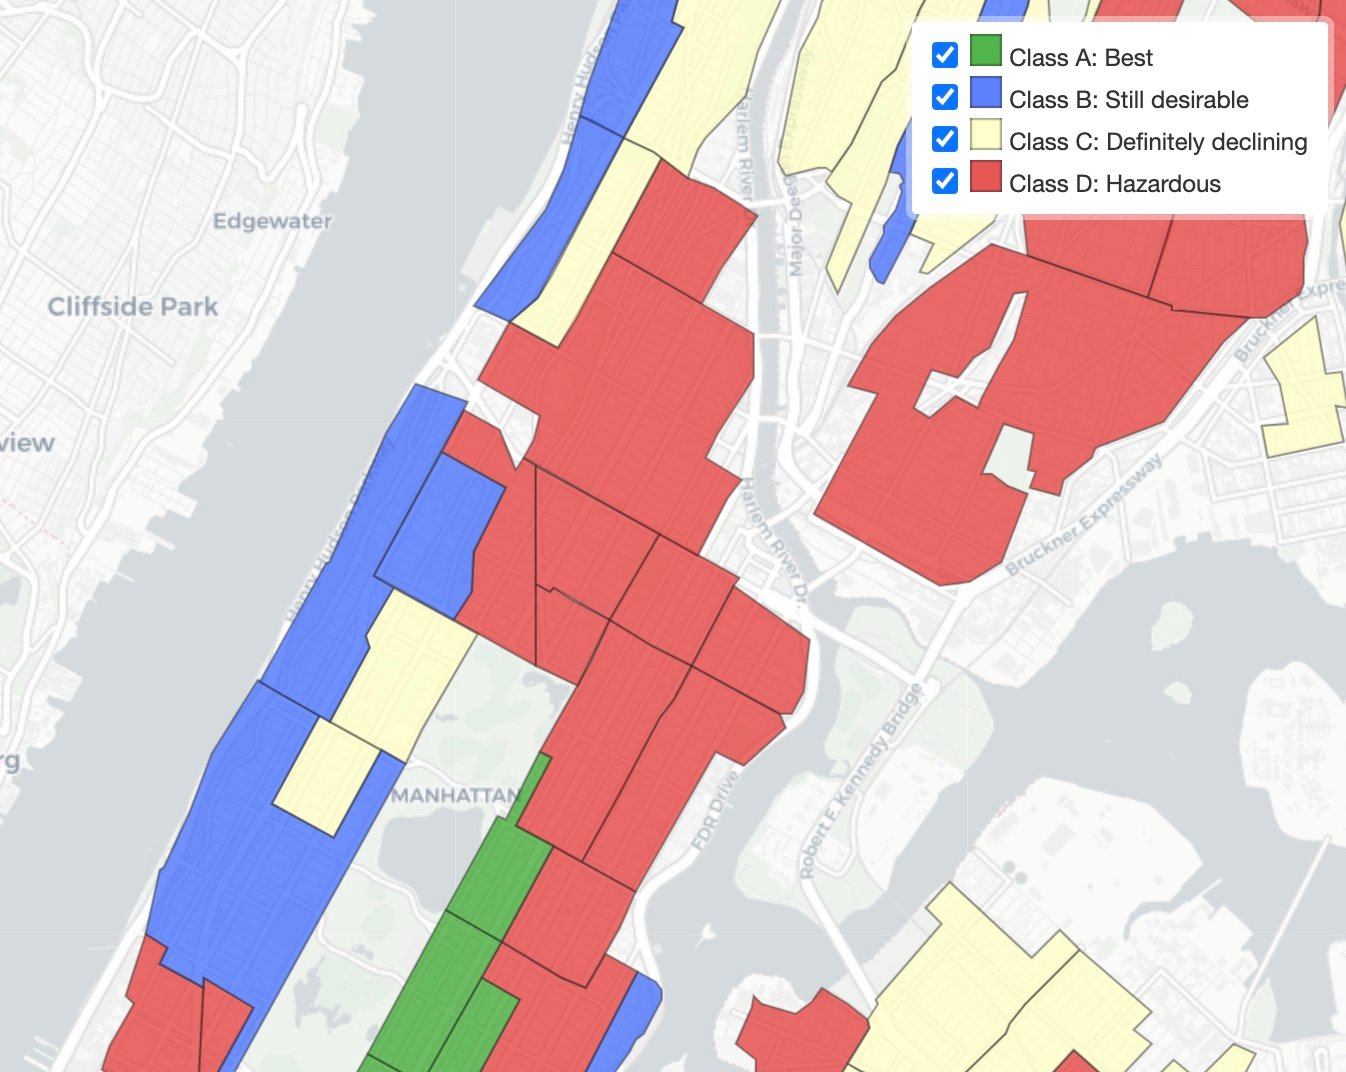
Decades of disinvestment, planned neglect, and overtly biased policies followed the devastation caused by redlining. The 1938 map below of northern Manhattan shows how our community was redlined:
The on-the-ground consequence of both redlining and its aftermath is seen in short film, shot from a car in the 1980’s. It has taken decades of public and private investment to bring Harlem back from this abyss even if there is still more work to be done.
To view the film as the camera person goes across 128th Street West(?) and then turns south on St. Nicholas and Frederick Douglass Blvd. see:
The Park Avenue Viaduct — a.k.a. the dark brown elevated tracks that carry Metro-North trains north of Grand Central — was built in 1893 and is in need of an upgrade.
After 129 years of operation, the tracks have started to show signs of stress, so the Metropolitan Transportation Authority (MTA) is making plans to replace sections between 115th-123rd and 128th-131st streets along Park Avenue.
The article on The Secret Bias Hidden in Mortgage-Approval Algorithms shows how communities of color routinely get fewer mortgage loans than white communities with the same income levels, housing stock, etc. The redlining of the 1930’s persists in other forms.
Nationally, loan applicants of color were 40%–80% more likely to be denied than their White counterparts
Even accounting for factors lenders said would explain disparities, people of color are denied mortgages at significantly higher rates than White people
An investigation by The Markup has found that lenders in 2019 were more likely to deny home loans to people of color than to White people with similar financial characteristics—even when we controlled for newly available financial factors that the mortgage industry for years has said would explain racial disparities in lending.
Holding 17 different factors steady in a complex statistical analysis of more than two million conventional mortgage applications for home purchases, we found that lenders were 40 percent more likely to turn down Latino applicants for loans, 50 percent more likely to deny Asian/Pacific Islander applicants, and 70 percent more likely to deny Native American applicants than similar White applicants. Lenders were 80 percent more likely to reject Black applicants than similar White applicants. These are national rates.
In every case, the prospective borrowers of color looked almost exactly the same on paper as the White applicants, except for their race.
In the New York/New Jersey area, if 100 people applied for a mortgage:
Findings were unreliable for Native American applicants. Source: 2019 HMDA Data, illustrations from ProPublica. We applied the odds ratios from our regression to White applicants’ actual denial rates to calculate the number of denials for each racial and ethnic group above. These numbers are not the actual denials or actual number of applications in each location, but rather have been standardized for comparison. We rounded to the nearest person.
The article continues that:
This algorithm was developed from data from the 1990s and is more than 15 years old. It’s widely considered detrimental to people of color because it rewards traditional credit, to which White Americans have more access. It doesn’t consider, among other things, on-time payments for rent, utilities, and cellphone bills—but will lower people’s scores if they get behind on them and are sent to debt collectors. Unlike more recent models, it penalizes people for past medical debt even if it’s since been paid.
“This is how structural racism works,” said Chi Chi Wu, a staff attorney at the National Consumer Law Center. “This is how racism gets embedded into institutions and policies and practices with absolutely no animus at all.”
If You’ve Got Kids, You Can Get Discounted Internet and Laptops/Tablets/Desktops
A federal program is offering New York families with children who attend public schools discounted internet and devices
Chalkbeat is reporting that because so few families have signed up for these amazing discounts, the Education Department is trying to spread the word that you can receive up to a $50 monthly discount on broadband service and equipment. Additionally, you can get a one-time discount of up to $100 on a laptop, tablet or desktop computer.
The discount is part of the federal government’s $3.2 billion temporary Emergency Broadband Benefit Program, which launched in May as part of the response to COVID’s public health crisis. The city’s education department promoted the program in a recent issue of its family-facing blog.
The program will last “when the fund runs out of money” or six months after the U.S. Department of Health and Human Services declares an end to the pandemic.
Everybody’s Eligible
Any families with children in schools offering free meals through the U.S. Department of Agriculture’s Community Eligibility Provision can sign up for this program — meaning it’s available to all students enrolled in New York City’s public schools, according to a spokesperson for the city’s education department.
Families must apply and find a broadband provider in their area participating in the program. Families can also check to see if their current providers are participating in the program. The broadband service then offers eligible families a discounted rate and is reimbursed by the federal government.
Families also qualify for several other reasons, including if they receive certain benefits, such as SNAP, or lost work last year and had a total household income in 2020 of $99,000 for single tax filers or $198,000 for joint filers.
Racism has always played a role in residential patterns in New York City. When New York City was a Dutch colony, it was just the southern tip of Manhattan. Wall Street got its name from the city’s protective wall.
In 1661, when Black people petitioned the colony for land in the area, they were given land north of the wall, outside of the city proper.
Throughout history, many different practices have shaped racial and residential patterns in New York City. In the 20th century, a practice called redlining made racism a federal policy – with long-lasting repercussions for our housing and our health.
Federal policy drove residential segregation.
In the 1930s, the federal government developed color-coded maps to guide loans to potential home buyers in cities across the U.S.
On these color-coded maps, neighborhoods were divided into 4 categories:
Best
Still desirable
Definitely declining
Hazardous
This classification was clearly rooted in racism, since neighborhood descriptions included statements like:
“Detrimental influences: Infiltration of Negroes. Mixed races.”
The government denied loans to Black and Latino people trying to buy homes in redlined neighborhoods. Instead, these resources went to new White-only suburban communities.
The map below shows how New York City’s neighborhoods were categorized.
This was redlining.
This process became known as “redlining:” systematically denying public and private resources based on where people live, targeting people of color.
Redlining helped drive urban segregation in the 20th century, as new neighborhoods were built for white people while people of color were forced into neighborhoods declared to be “declining.”
Since home ownership is an important way to accrue wealth, redlining drove economic inequality, too – by denying people of color the same opportunities for home ownership that white people had.
East Harlem’s Union Settlement Sues NYC’s Department Of Education
Union Settlement, one of the largest nonprofit early childhood education providers in New York City.
Announced today that it is suing the New York City Department of Education (DOE) to reverse a flawed contract award process that is having a severe adverse impact on young children in East Harlem, as well as their parents and the small businesses that provide early childhood services.
In 2019, DOE issued a Request for Proposals (RFP) to identify organizations to provide early childhood education services throughout New York City.
This included proposals for organizations to operate Family Child Care Networks (FCCNs), which are networks of individuals and small businesses providing child care services in their homes.
Union Settlement has overseen an FCCN for decades, and offered to continue operating that program, overseeing a network of providers serving children ages six weeks old to four years old, from 8 a.m. to 6 p.m. every weekday, 12 months per year (referred to as “extended day/year” services).
Contrary to the terms of the RFP, DOE instead awarded Union Settlement a contract to serve only 3-year-olds, only until 2:30 p.m. each day, and only during the school year (referred to as “school day/year” services).
This violation of the RFP process harms children, families and providers in six different ways:
Children make deep connections with caregivers, and are harmed by continuing changes in caregivers. Allowing FCCN providers to serve children ages from 6 weeks old to 4 years old creates a multi-year period for the child to be with the same early childhood educator, rather than having one individual up to age 3, another at age 3, and another at age 4.
Working parents – particularly single parents – need full-day care for their children and need care 12 months per year. The “school day/year” model does not work for these parents because they have to make alternative arrangements for their children in the afterschool hours, as well as in July, August and during school holidays.
School day/year services are also harmful to children, who as noted above benefit greatly by making strong connections with their caregivers, rather than having to transition to someone new every afternoon and during the summer months.
The FCCN providers are small businesses offering early childhood education services in their homes. To be financially viable, those small businesses need to take care of children for the entire day, and they cannot afford to shut down their businesses for two months in the summer, and during the many school holidays.
Allowing FCCN providers to care for children from 6 weeks to four years old creates a continuum of care not just for the children, but for the providers as well. Limiting care to just 3-year-olds forces FCCN providers to recruit an entirely new set of children every year, which again undercuts the financial viability of their businesses.
Finally, while providers in wealthier neighborhoods can keep their businesses open by bringing in “private pay” children from wealthier families, this is not an option for FCCN providers in low-income communities of color like East Harlem, where most families do not have the financial means to do so.
The process that DOE used to make the FCCN awards violated the clear language of the rules set forth in the RFP, and Union Settlement has made multiple efforts over the past year to resolve this matter, including proposing resolutions that would eliminate all of the harms noted above, without imposing any additional costs on DOE.
Those efforts were unsuccessful, and Union Settlement has now been forced to sue DOE to prevent these harms from occurring.
“I simply do not understand why DOE wants to force litigation in this matter, where the flaws in the decision-making process are so clear, and there is an easy resolution that benefits the children, families, and caregivers, and that costs DOE nothing,” said David Nocenti, Executive Director of Union Settlement. “I hope that Chancellor Meisha Porter, who was not involved in the original decisions, will take a hard look at this and decide to take action to benefit the children, families and small businesses here in East Harlem.”
“Our goal is to prepare community members to establish and run their own home-based child care businesses which provide a safe and caring learning environment for children,” said Denise Ramos, Union Settlement’s Interim Director of Early Childhood Education. “My heart goes out to the providers, parents, and children who are caught in the middle of this unfair situation that can be easily remedied without cost to DOE.”
“I only have one child enrolled in my program and I usually have six to seven kids. I am struggling to pay my monthly rent of $3,800, and I was recently served a court order due to my inability to pay because my income is reduced,” said Maria Martinez, a Family Child Care Network provider. “I have successfully operated my child care business for 16 years which allowed me to provide for myself and my sons. If the DOE does not change the award so I’m able to enroll more children, I will be forced to close my child care business.”
“I am worried about losing my job in retail because I am only able to work limited hours because I don’t have anyone to care for my son after 2:30pm,” said Wendy Diaz, an East Harlem parent. “As a single mom, I can’t afford to pay the provider out-of-pocket and don’t have anyone else to take care of my son in the afternoons or during the summer when no care is available.”
“DOE’s failure to amend the award is adversely impacting East Harlem, one of the poorest neighborhoods in New York, as it tries to overcome the longstanding health and economic disparities it has always faced, and that have been exacerbated by the COVID-19 pandemic,” said Mr. Nocenti. “Amending the award will benefit East Harlem children and parents, because this community needs extended-day, extended-year care for children of all ages, and also will benefit the FCCN providers, who need to stay solvent and feed their own families.”
Union Settlement is an on-the-ground resource for East Harlem residents of all ages, and a passionate advocate for the needs of underserved communities.
Established in 1895, Union Settlement provides a broad array of education, wellness and community-building programs to over 10,000 East Harlem residents each year, including early childhood education, afterschool and summer youth programs, college preparation, job readiness, English language classes, behavioral health counseling, small business assistance, senior centers, Meals on Wheels and more.
Residents of some neighborhoods are at much greater risk of experiencing violence – and its many health effects.
Violence is rooted in historical disinvestment and racism.
Evidence shows that violence results from social structures that limit access to basic needs – structures that are fueled by racism, residential segregation, and neighborhood disinvestment. Where these structures persist, people are exposed to violence. For example, low-income neighborhoods of color are known to be hit the hardest.
This map shows the parts of NYC that were redlined 90 years ago as part of racist housing policy that set off decades of disinvestment and intergenerational poverty.
A map of recent shootings lines up with the heavily redlined areas of the Bronx, Harlem, and northern and eastern Brooklyn – showing clearly how today’s violence is closely related to the ways that racist policies are embedded in our society.
Decades of government and societal disinvestment from practices like redlining means limited opportunity and resources, and results in higher rates of poverty in some neighborhoods.
As a result of this disinvestment, we see a clear relationship between poverty and violence. As a neighborhood’s poverty level increases, so do assaults.
Cars Parked in Front of a Hydrant (with NYPD Placards…) Delay FDNY Response
Two cars with NYPD placards parked on an East Harlem fire hydrant as firefighters rushed to extinguish a brownstone fire. This caused a delay in water as the chauffeur had to maneuver the supply line under and around the cars.
This is a major issue recently with cars blocking nearly every hydrant in the city, not only making them hard or impossible to use , but making them incredibly hard to locate.
When seconds count, these cars could be the difference between life and death.
Cayuga will be hosting a pop-up COVID vaccine clinic at our location on Third ave location. Here are the details: When: Thursday 05/06 and Friday 05/07
When: 8:30 am – 5:30 pm
Where: Cayuga Centers (2183 Third Ave, New York, NY 10035)
Brand: Moderna Walk-ins will be accepted on a limited basis. If interested in being vaccinated at our clinic please email Yiseily De Los Santos at [email protected]g or call at (646) 988-6718 to secure an appointment.
More on Redlining
The digitized versions of the 1930’s redlining maps are fairly ubiquitous these days.
What is often not discussed is that in the early 20th century the white men who drew these maps predicted that the waterfront of the Upper East Side (then with breweries, warehouses, factories, and a mostly German and Slavic immigrant community) was going to go downhill. We also need to recall that the presence of the 2nd and 3rd Avenue Els were also a source of class-panic in that the depressed land values under the Els and the sorts of businesses that located there, seemed to portend a dark future.
In the illustration, above, you can see the almost complete expectation (by the redlining teams) that the Financial District and the LES + Chinatown, would invariably become ‘hazardous’ investment locations.
Redlining, however, did more than predict a community’s viability as a site of investment, it also determined community’s futures by starving them of capital and slowly consigning any existing property owners in ‘hazardous’ areas to insolvency or bankruptcy.
FDNY and High Winds
Last week with the high winds, the FDNY was called to investigate loose metal flashing that appeared unsafe on the Church of All Saints.
Nothing major was discovered at this recently sold building.
If you’re curious about the issue of redlining, join The Washington and Chicago Map Societies on December 3, 2020, 7:00 pm when they present Linda Gartz in a Zoom discussion: “How Federal Government Redlining Maps Segregated America.”
She will discuss her award-winning book, “Redlined,” and her discovery of the redlining maps used by the federal government to exclude African-Americans from the middle-class dream of home ownership. Inspired by a trove of long-hidden family letters, diaries, photos, spanning the 20th Century, “Redlined” interweaves a riveting family story with the history of redlining. Linda will display digitized versions of original redlining maps, share photos, read short excerpts from “Redlined,” and speak about the lasting impact of redlining maps that segregated America. RSVP John Docktor at [email protected] to receive the meeting ID and passcode.
The governor has noted a Covid “yellow zone” in Upper Manhattan including zip codes 10031, 10032, and 10033.
* No gatherings indoors/outdoors over 25
* Dining indoors/outdoors no more than 4 per table
* Houses of worship at 50% capacity
A Historical Perspective on Redlining
The Where We Live NYC report has a fantastic explanation on the history and impact of redlining:
One of the most pernicious tools in promoting segregation was the construction of explicitly segregated housing developments, many of which were owned or financed by the city, state, or federal government. This practice began in 1928, when the Thomas Garden Apartments opened near the Grand Concourse in the Bronx for White families and the Paul Lawrence Dunbar Apartments opened in Harlem for Black families. It continued through the 1930s, when New York City experienced several waves of immigration in the 20th century, originally from Europe and eventually the rest of the world. The arrival of large numbers of Italians and Eastern European Jews in the early 20th century led Congress to pass discriminatory laws to limit the growth of those populations and others. Immigration patterns changed dramatically after World War II, however, with the arrival of over 600,000 Puerto Ricans in the 1940s and 1950s. By 1970, Puerto Ricans accounted for over 10 percent of the city’s total population. The passing of the Hart-Celler Act in 1965, which abolished the use of immigration quotas based on national origin, created more opportunities for immigrants from all over the world, including the Caribbean and Latin America, East and South Asia, the Middle East, and Africa. These cycles of immigration have contributed to the formation of the city’s many ethnic enclaves, which formed as networks of support and community and as a form of protection against the discrimination and violence many immigrants experienced upon their arrival to New York City. The New York City Housing Authority (NYCHA) opened the Harlem River Houses for black households and the Williamsburg Houses for White households in 1937 and 1938, respectively.
The most significant examples were two enormous government-supported housing developments built by the Metropolitan Life Company exclusively for White families: Parkchester in the central Bronx, which included 12,273 apartments for 42,000 people, and Stuyvesant Town in Manhattan, which included 8,775 apartments for 27,000 people.
Even though protesters denounced the City for providing land and tax breaks to these projects and sued MetLife over its exclusionary policy, Frederick Ecker, the company’s president, stuck to his position that “Negroes and whites don’t mix.” In an attempt to appease its critics, MetLife also developed the Riverton Houses, a 1,200-unit development in Harlem that, while nominally open to all races, attracted mostly Black residents. The People’s Voice, a weekly newspaper based in Harlem, predicted that these projects were “crystallizing patterns of segregation and condemning thousands of Negroes to a secondary citizenship status for generations to come.”
At the same time, federal housing policy also explicitly subordinated people of color, most importantly through a mortgage-lending process that came to be known as “redlining.” Beginning in 1933, the federal agency responsible for refinancing mortgages—the Home Owners’ Loan Corporation (HOLC)—created “Residential Security Maps,” which labeled neighborhoods as
“A (Best),”
“B (Still Desirable),”
“C (Definitely Declining),”
“D (Hazardous),”
ostensibly to judge the riskiness of issuing mortgages in each type of neighborhood. Each neighborhood was also color-coded: “A” was green; “B” was blue; “C” was yellow; and “D” was red.
The image above shows an example of a HOLC map for Upper Manhattan. The systematic use of these maps by the federal government and local banks had substantial, disastrous, and long-lasting impacts on racial inequality. Neighborhoods where HOLC found a sizeable presence of “undesirable” residents—which in New York City included immigrants from Southern Europe, “Communistic” Jews, and others— were deemed ineligible sites for federally-insured mortgages. HOLC was particularly concerned about the presence of Black New Yorkers; any neighborhood in which Black New Yorkers were more than 5% of the population was labeled “C (Definitely Declining)” or “D (Hazardous),” and it was all-but-guaranteed that a prospective homebuyer could not receive a mortgage in such a neighbohood.
The Mortgage Conference of Greater New York even commissioned a block-by-block survey of New York City to show where “Negroes and Spanish-speaking persons resided,” though blocks that housed Black and Hispanic building superintendents were exempted. The Mortgage Conference directed its 38 members to refrain from issuing mortgages to any properties on such blocks, depriving neighborhoods with Black and Hispanic residents of access to capital and encouraging White residents to move to segregated neighborhoods or suburbs where loans were available.
Mortgages were available in suburban developments on Long Island and in Westchester because the vast majority of these developments were open only to White residents. The most famous development—Levittown, New York—opened to 17,500 veterans and their families immediately following World War II under the federal government’s condition that only White residents would live there. Levittown residents also became homeowners thanks to the G.I. Bill, which offered low-interest loans and required no down payments. Almost all people of color were excluded from this crucial, life-changing opportunity to build equity in their homes and pass down wealth to future generations. During the immediate post-war period, per capita mortgage lending in Nassau County, New York, where Levittown and many other Whites-only developments were located, was eleven times greater than lending in Brooklyn and 60 times greater than lending in the Bronx.
Segregated suburban developments, which expanded with significant support from government, also helped determine who remained in or moved to New York City. Hundreds of thousands of New Yorkers, predominantly people of color, were forcibly displaced from their homes by the construction of taxpayer-funded highways, which served the segregated suburbs. Subsidized mortgages and segregated living patterns also drew a sizeable portion of the city’s middle-class tax base to the suburbs; in the 1950s alone, the suburban region’s population increased by almost 2.2 million people, while the city’s population decreased by 109,973 people—the first decennial decline in the city’s history.
The expansion of segregated suburban developments also pushed government officials to take drastic steps to alter some of the city’s central neighborhoods through massive redevelopment projects, which often consisted of displacing people of color from their homes and building more expensive housing in their place. In turn, people of color were directed to even more segregated neighborhoods in Upper Manhattan and Central Brooklyn.
The combined influence of redlining, segregated housing developments, and rampant discrimination in the employment and education fields concentrated low-income people of color in small geographic areas and created a “new form of urban poverty.” Poor living conditions in these neighborhoods—often referred to as ghettos—also stigmatized people of color in the eyes of many White residents, who feared that their neighborhoods and schools would become unstable if integration occurred. Many New Yorkers responded to these forms of racism, economic oppression, and subjugation with grassroots organizing and legislative advocacy, and New York City became a leader in innovative, civil rights lawmaking in the 1950s.
Complain to the DOT
If you notice something on a road, sidewalk or bridge that isn’t right, you can submit a complaint to the Department of Transportation on any of these subjects:
I contacted them recently about a lack of a pedestrian ramp on the Madison Avenue Bridge, and they got back to me the next day with the promise that they’d send a crew out to investigate within 45 days.
Speedy? No. But as we always say, they can’t read our minds, so unless we complain, and tell them what’s not working or acceptable in our community, they’ll just assume all’s well. Don’t accept. Demand better. Demand action.
While East Harlem has 1.5% of New York City’s population, it has 13.6% of New York City’s drug treatment capacity, according to data as of 2019 from NY agency OASAS. The graphic below illustrates how severely East Harlem is oversaturated with drug treatment facilities. This unfair social injustice MUST END!
Data source: NYC Government OASAS Agency as a FOIL request by Y Pielet as of April 2019
With so many patients commuting into East Harlem for drug treatment, our district is overburdened while already struggling with other social, environmental, economic, and educational issues. Petition to your elected officials – Send Email or call them -to either dramatically reduce our 13.6% burden or perhaps allocate 13.6% of New York City’s budget as a compensation for this injustice.
Drilling down to the data, we can see that Beth Israel Medical Center and Harlem East Life Plan alone contribute to nearly 60% of the capacity. Elected officials should immediately discuss ways to reduce this capacity.
As for which district is not receiving its fair share of drug treatment capacities? Data speaks for itself
While the most important election of our lifetime is now only 47 days away, our city will also be reshaped by the 2021 elections which include electing a new mayor.
The City (an online NYC new organization) is soliciting your questions for mayoral hopefuls. Please take a moment and go to:
and (among other things) please ask the candidates to address the issue of how systemic racism has resulted in an oversaturation of addiction programs being located here, in Harlem and East Harlem, and what (as mayor) they would do to ensure that wealthier and whiter communities take their fair share of new and existing programs.
We want this issue to be on their radar, early in the process.
Racism, Heat, and Barriers to Access
WeAct for Environmental Justice has an interesting paper out on how public access to open, green spaces maps remarkably onto redlined Manhattan:
The heat stressed communities (mapped in dark red) are clearly similar to the redlined map (above):
Correlation is not causation, of course, but it does point to how systemic (and multimodal) the complex issues of racism, history, policy, economics, and more are. All these causes and consequences are not just intertwined, but also reinforcing.
As the authors note:
Northern Manhattan is home to beautiful parks, but many less visible barriers remain, limiting access to these spaces for surrounding residents. Another recent analysis revealed “parks serving primarily nonwhite populations are half the size of parks that serve majority white populations and are five times more crowded.” This poses significant safety challenges to urban residents of color who are turning to these public green spaces to practice social distancing and cool down amidst the COVID-19 pandemic. Furthermore, people of color may be deterred from spending time in green spaces by fear of unfair treatment by police. Other occupants of the green space, namely white people, also pose potential threats to the safety of people of color, as demonstrated by the recent example of Amy Cooper threatening Christian Cooper in Central Park.
Hello Harlem friends, neighbors, and yogis, this could be you!
Lucia Russett has been teaching outdoor, in-person yoga classes through Harlem Yoga Studio–and they’re now extending their schedule!
Lucia will be there every Monday starting tomorrow, 9/14, from 5:30-6:45pm, as long as the weather holds. Here are the details:
We’ll meet in the NE corner of the park at 124th and Madison. At 5:30, we’ll walk up the path together to the fire watch tower area, which has a quiet, open space for yoga.
Bring your own mat. The ground there is paved, so extra padding would be helpful.
Sign up in advance on the HYS website.
Other park classes (with a rotation of teachers) are Wed. evenings at 5:30, and Sunday and Tuesday mornings (on the grass) at 10.
Mats will be spaced; wear a mask until you’re on your mat.