Tag: Poverty
-

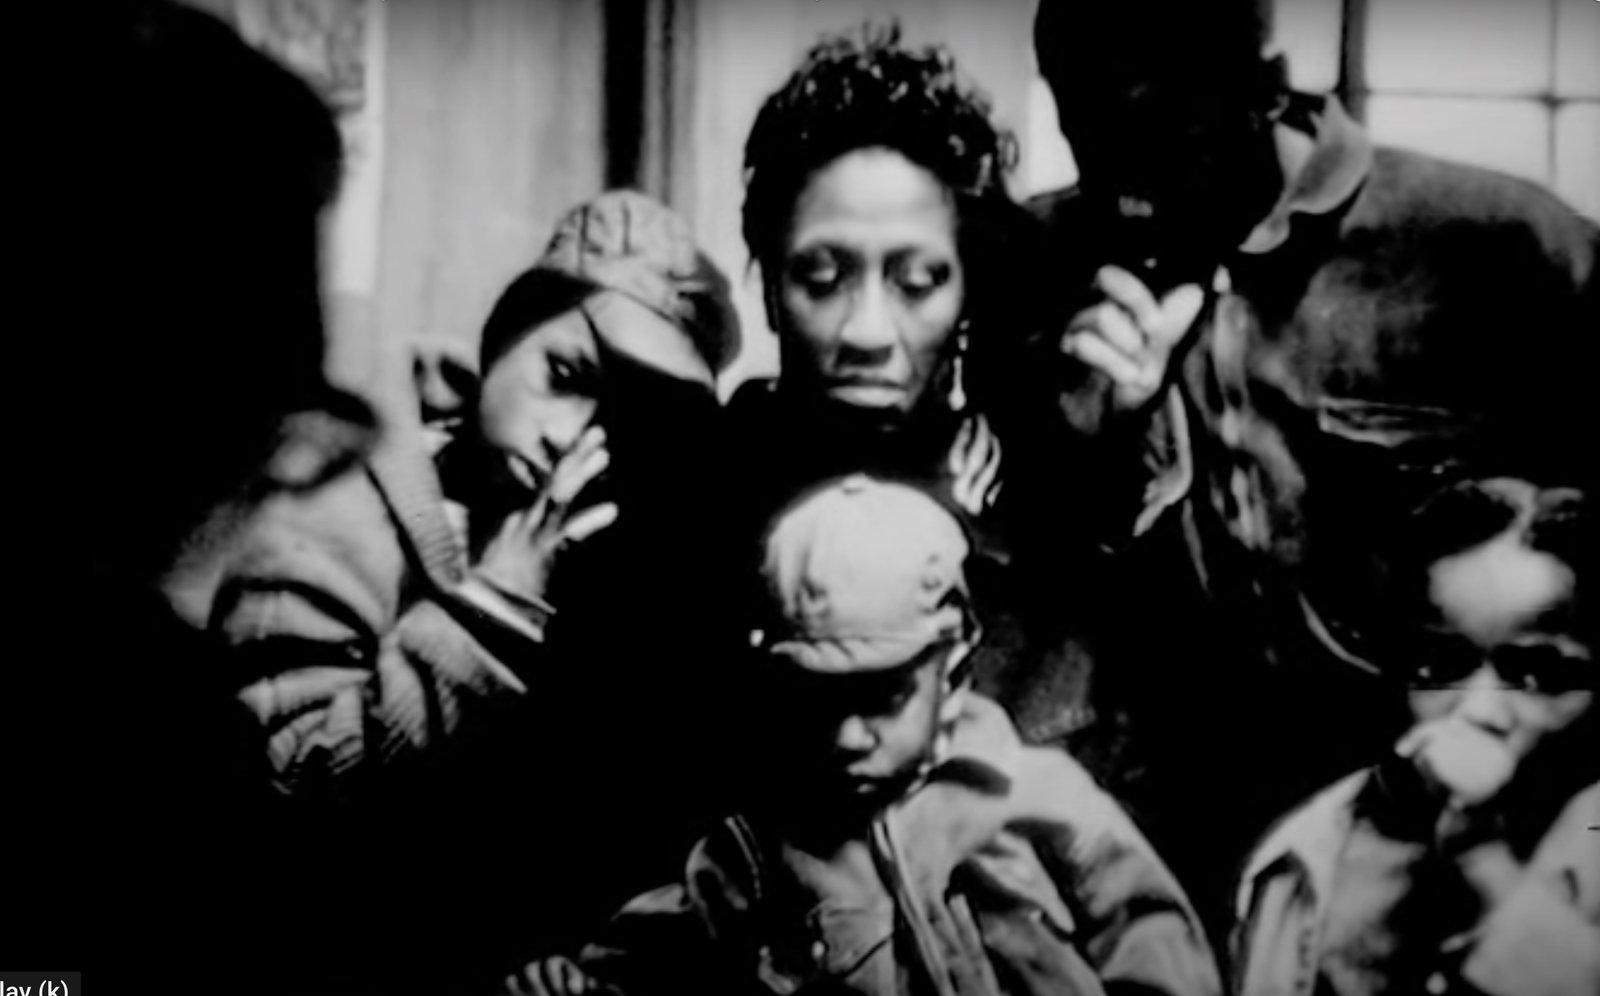
GORDON PARKS: 1968
This black and white documentary of a Harlem family was made in 1968 by the famous photographer and filmmaker, Gordon Parks. Using his still photos for Life magazine, Parks illustrated the crushing effect poverty had on every member of this Harlem family who lived on Frederick Douglass Blvd., in the 130’s. Gordon Parks noted that…
-

Asthma+Poverty
Throughout the city, neighborhoods with higher rates of poverty also experience higher rates of childhood asthma, which we can see from the rates of emergency department visits. On the scatter plot below, each dot represents one neighborhood. Its horizontal position represents the neighborhood’s poverty rate, and its vertical position represents its asthma rate. The pattern…
-

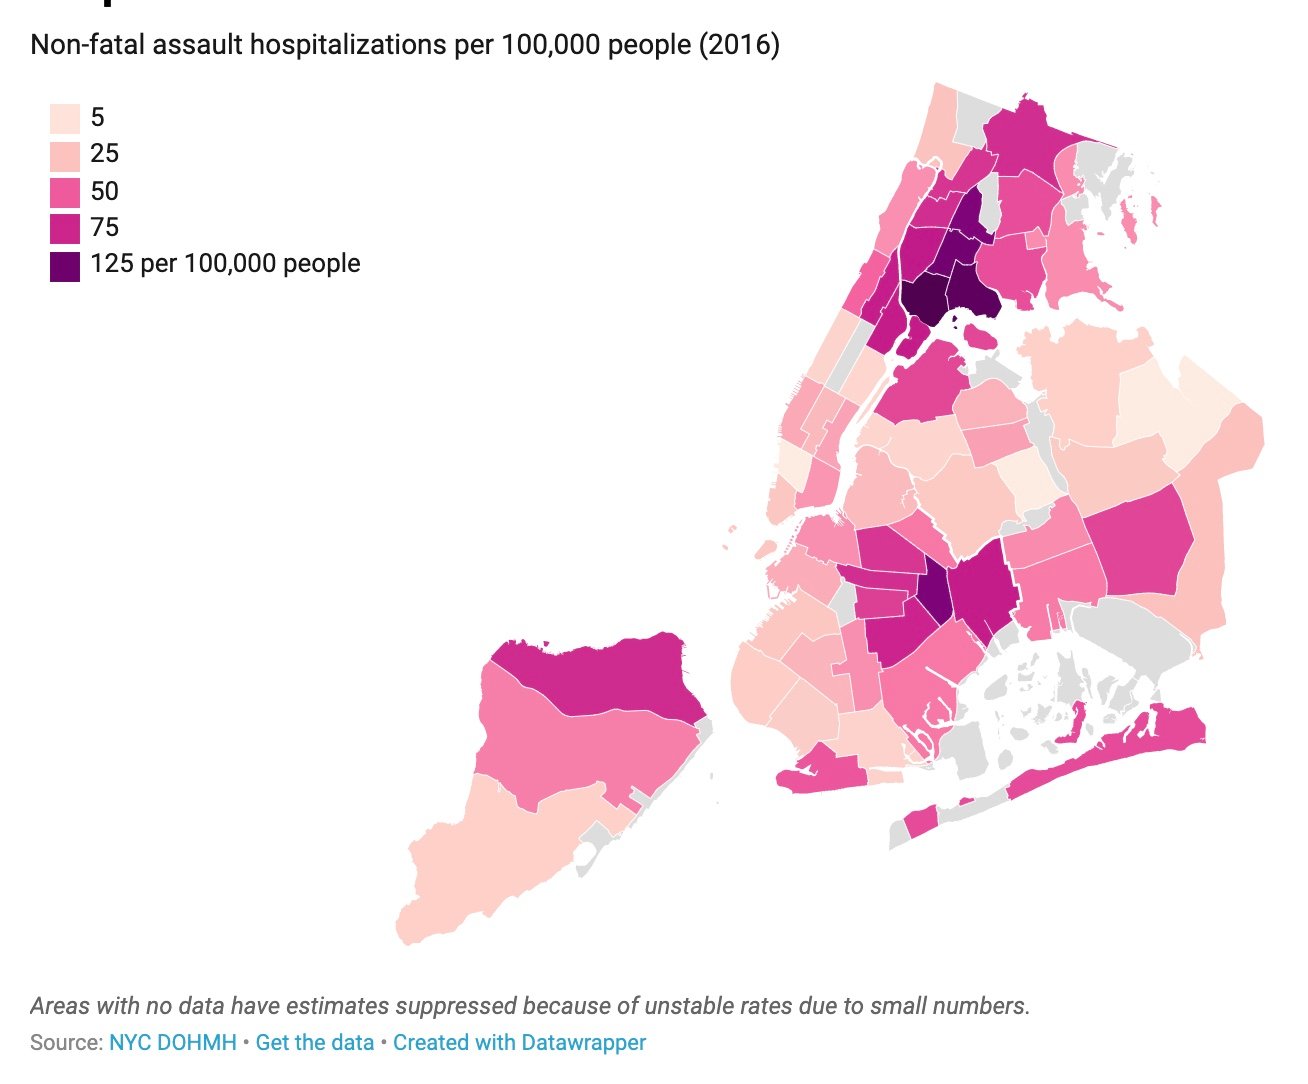
Violence
An assault, a shooting, a homicide, or any use of force affects people in many deep ways. Violence causes physical and emotional harm. It can inflict fear, a constant sense of unease. It can cause short- and long-term trauma. Violence can affect people throughout their lives – including their health. It can lead to poor…
-

Shootings
Residents of some neighborhoods are at much greater risk of experiencing violence – and its many health effects. Violence is rooted in historical disinvestment and racism. Evidence shows that violence results from social structures that limit access to basic needs – structures that are fueled by racism, residential segregation, and neighborhood disinvestment. Where these structures…
-

Drug Arrests
Vice has a fascinating look at how drug arrests have plummeted in the decade from 2009 to 2019: https://www.vice.com/en/article/dy8k97/how-new-york-quietly-ended-its-street-drug-war Just this visualization (below), showing the massive drop in the number of NYC drug arrests in 2009 to 2019 (red line) and the number of drug convictions from 2009 to 2019 (white line) is stunning: The…
-
Murder, Density, and Cars
Here are a 3 maps I’ve come across recently. The NYPD maps, of course, murder and other crimes committed throughout the 5 boroughs. As you can see, the data below shows a non-random distribution of murders committed in NYC: This data (the latest available) is a year’s worth, from Oct. 2019 – Oct. 2020. Below…
-
Holiday Season and Poverty
As we approach the holiday season, I wanted to ground us all by noting how unevenly poverty is spread across the 5 boroughs. This map of the shameful persistence of poverty, asks us all to think about what we can do to address income, educational, and opportunity inequality.