Tag: 2020 Census
-

2020 Census Data on Hispanic New Yorkers
A view of Zip Code 10035 from the 2020 Census. You can see that over the last 30 years, the percentage of Hispanics went down from 62% to 54% – still the largest group by far, in this zip code. In this map of northern Manhattan (above) you can see the grayer areas where the…
-

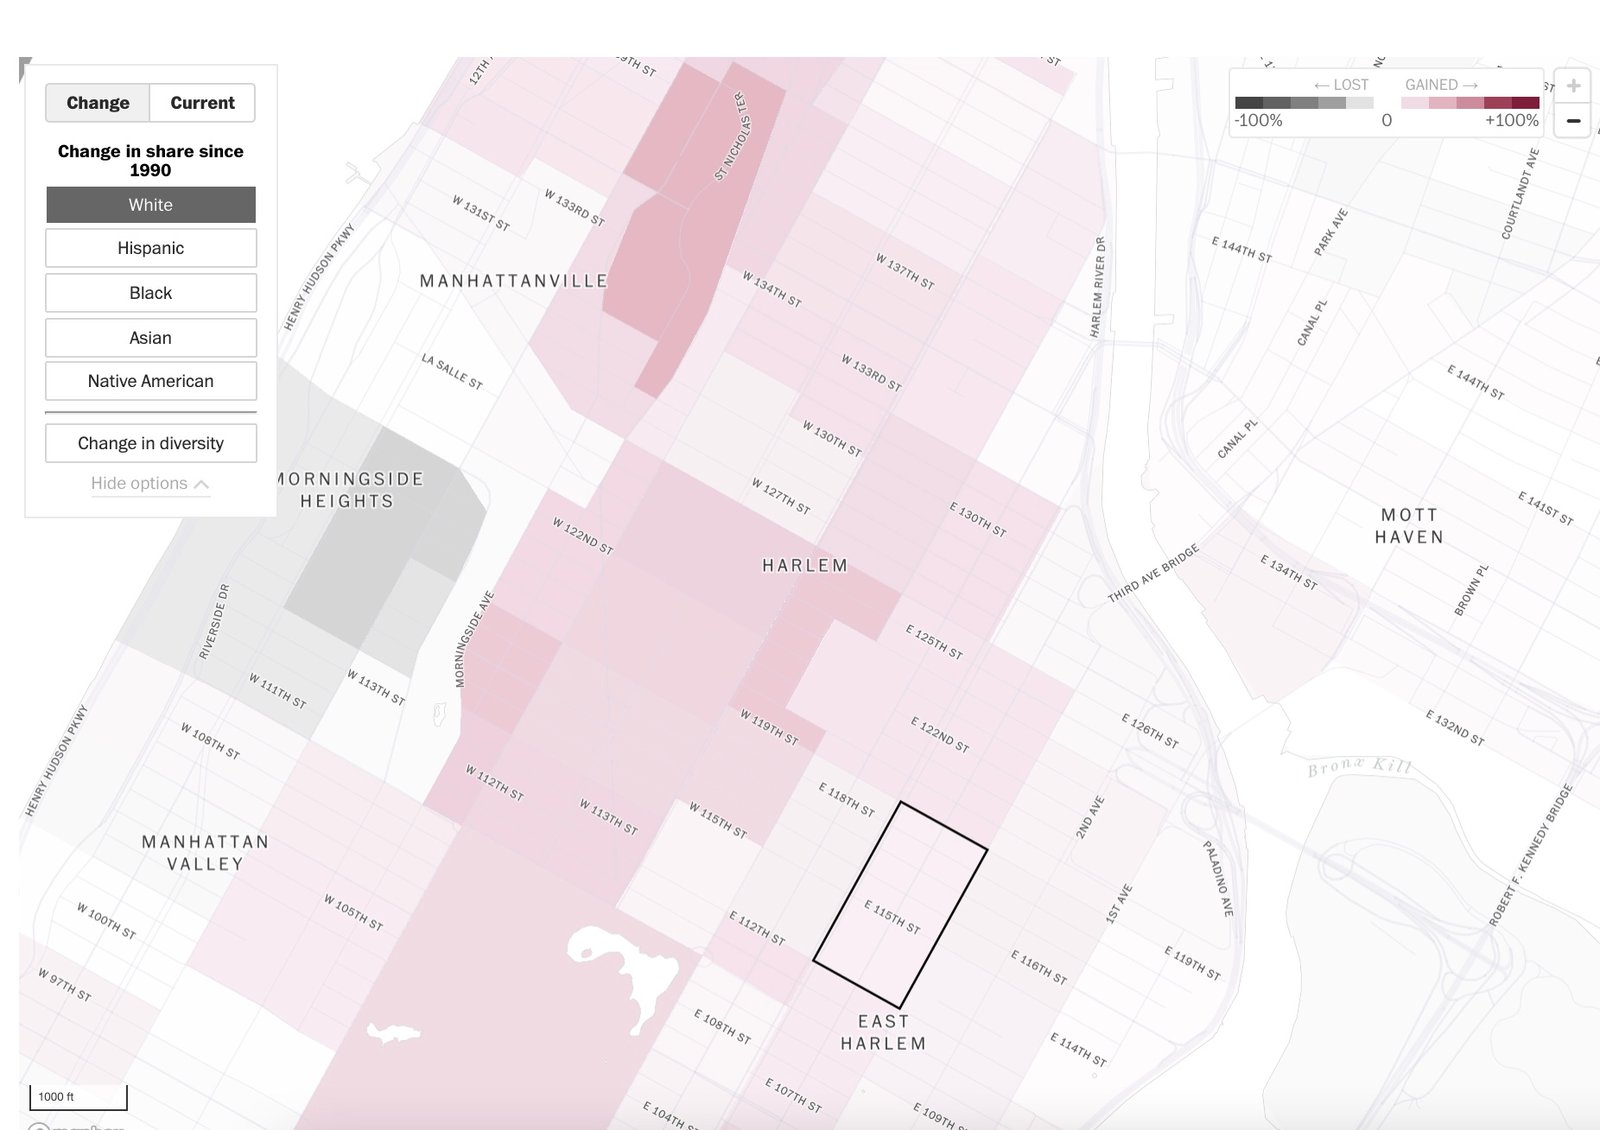
2020 Census Data on White New Yorkers
A view of Zip Code 10035 from the 2020 Census. You can see that over the last 30 years, the percentage of white residents went up from 1% to 10%. In this map of northern Manhattan (above) you can see the grayer areas where the percentage of white New Yorkers went down, and the pink…
-

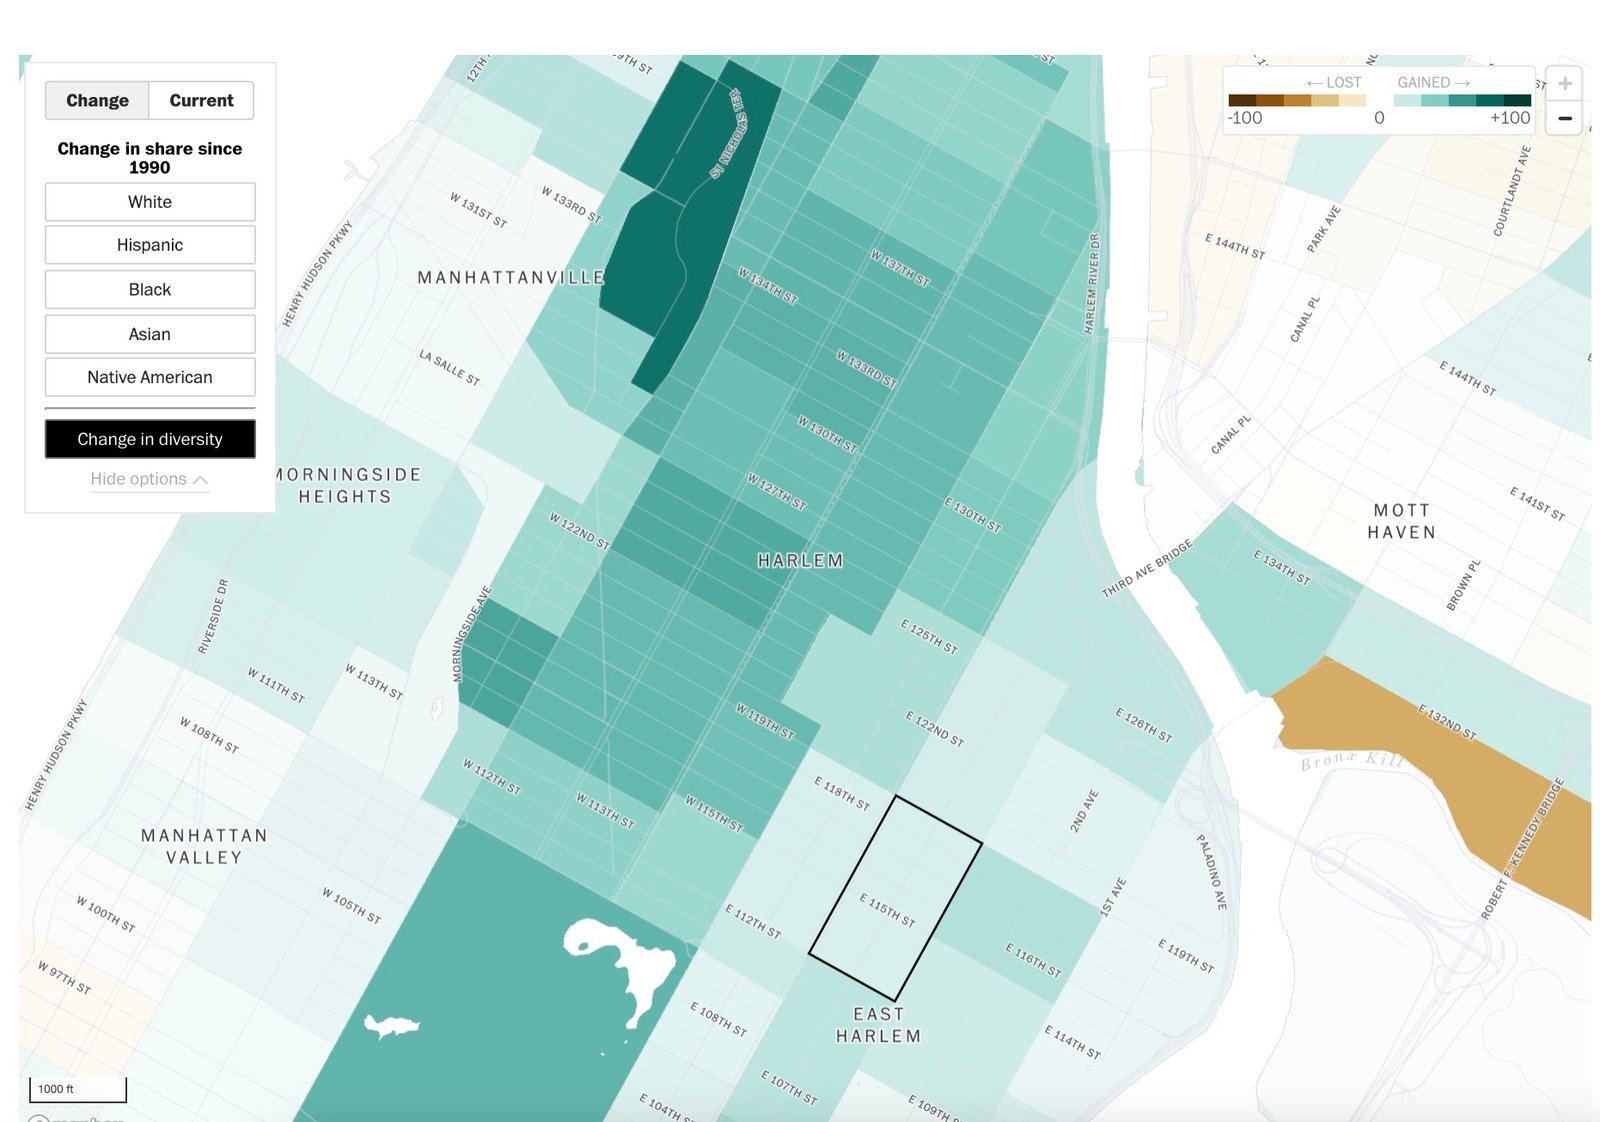
2020 Census Data on Diversity
New York is a highly segregated city, and so it is interesting to see where diversity is increasing (or decreasing) in Northern Manhattan: In this map of northern Manhattan (above) you can see that in most of the areas shown, the diversity has increased – with the glaring example of the South Bronx, and a…
-

2020 Census Data on Asian New Yorkers
A view of Zip Code 10035 from the 2020 Census. You can see that over the last 30 years, the percentage of Asian residents increased from 1% to 6%. In this map of northern Manhattan (above) you can see the grayer areas where the percentage of Asian New Yorkers went down, and the green areas,…
-

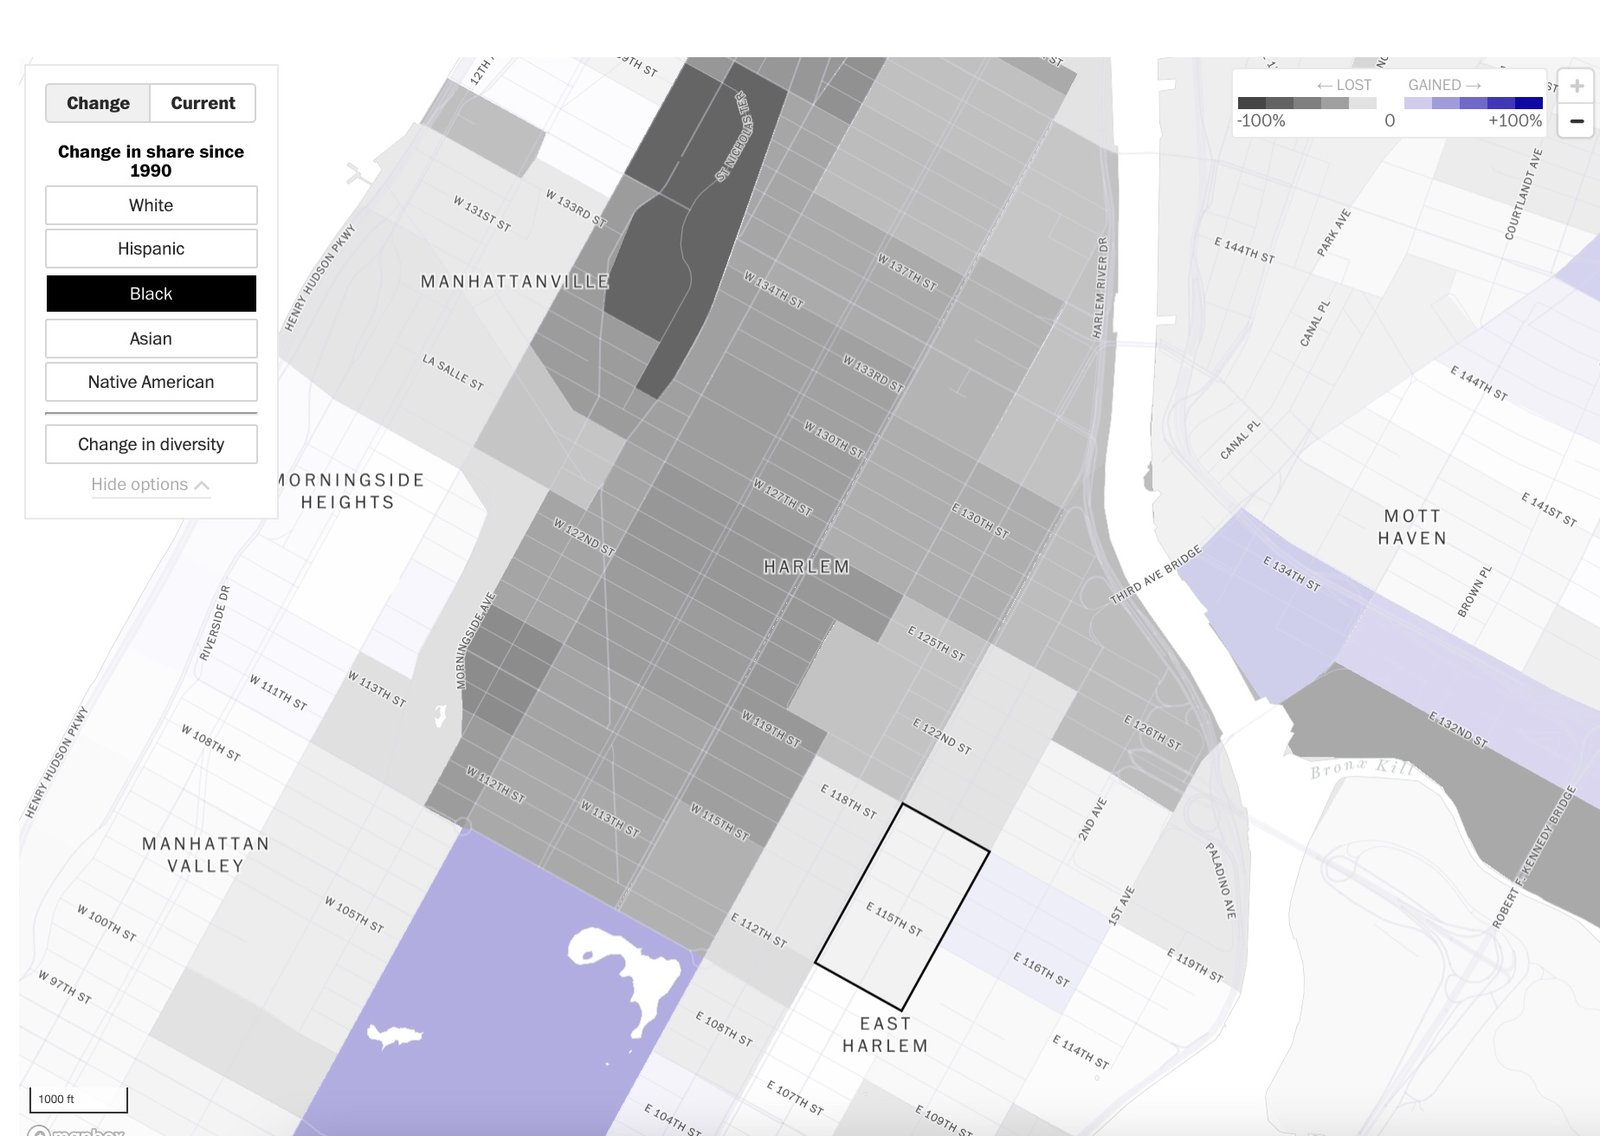
2020 Census Data on Black New Yorkers
A view of Zip Code 10035 from the 2020 Census. You can see that over the last 30 years, the percentage of Black residents went down from 35% to 26% – still the second largest group in this zip code. In this map of northern Manhattan (above) you can see the grayer areas where the…