Category: Maps
-

George Floyd
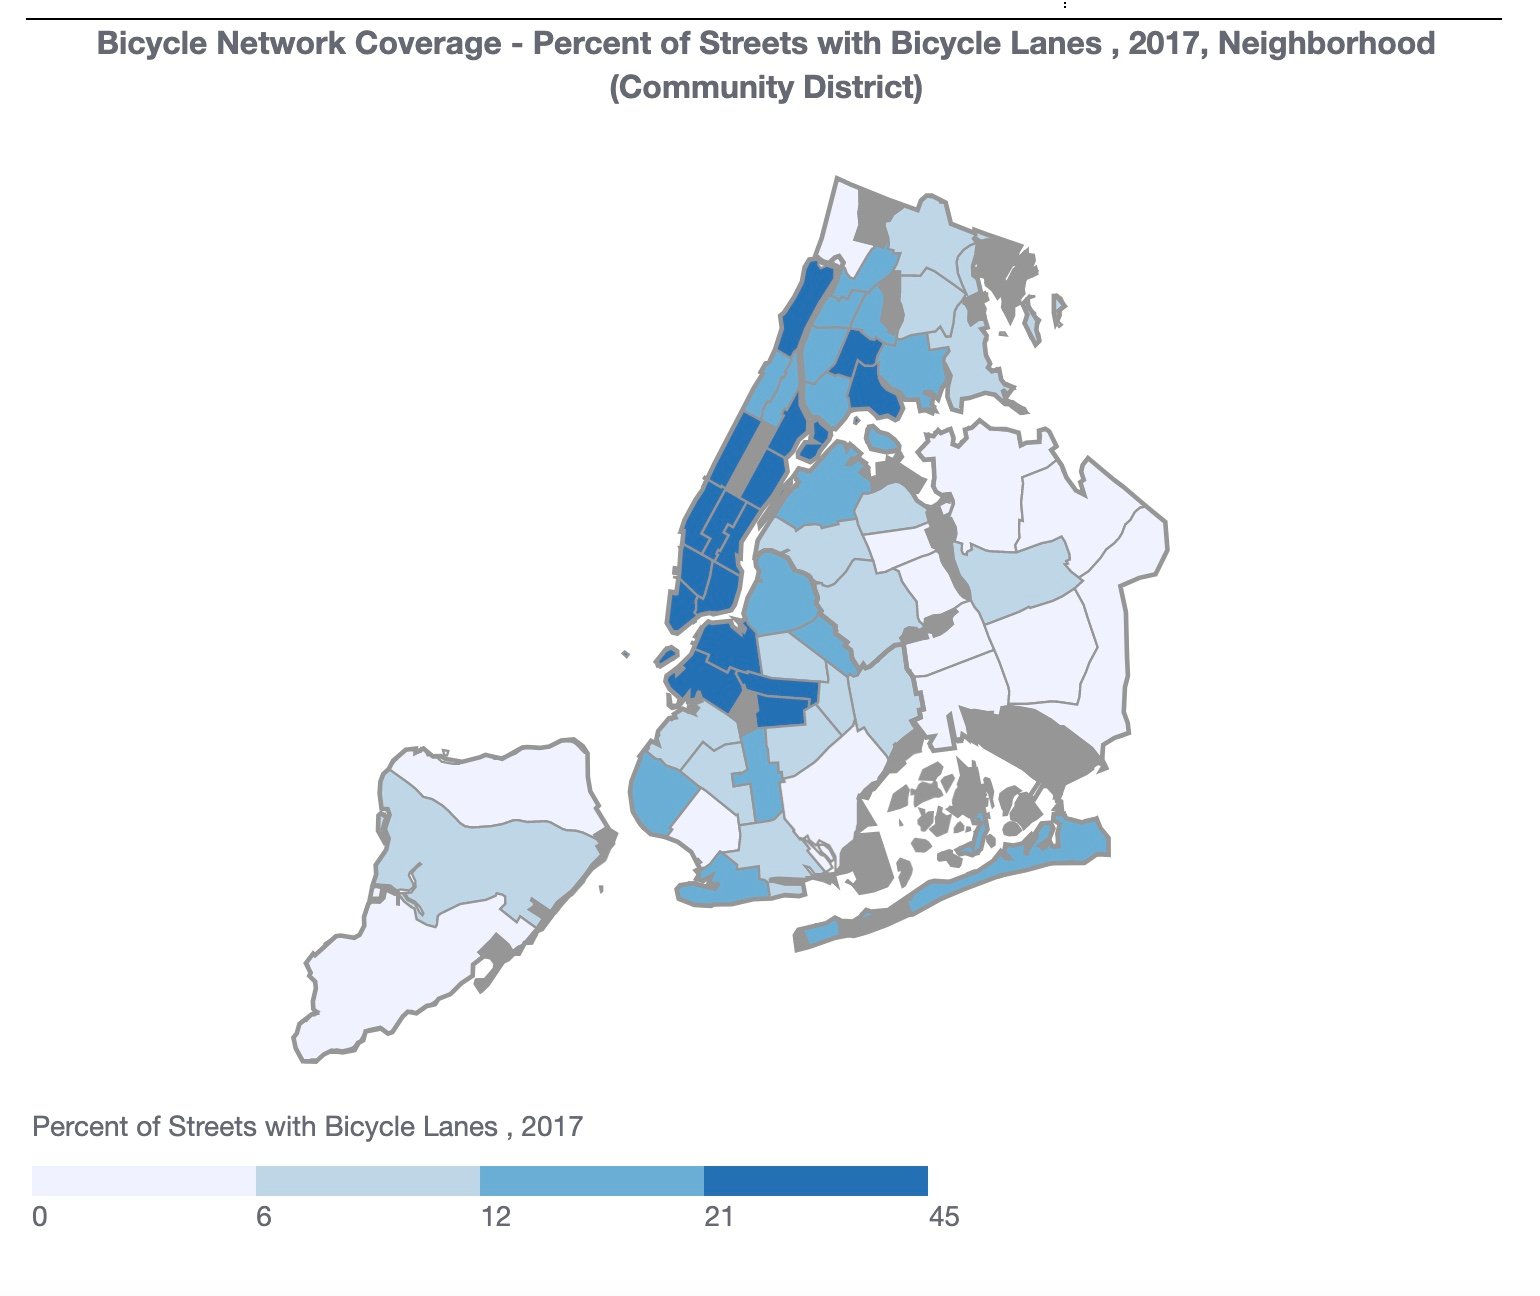
One year ago. Born: October 14, 1973, Fayetteville, NC Died: May 25, 2020, Minneapolis, MN Bicycle Lane Density The percent of streets with bike lanes can affect cyclist and pedestrian safety, physical activity, and sustainable transportation use. About the Measure Bicycle Network Coverage – Percent of Streets with Bicycle Lanes Percentage of streets with bicycle lanes (conventional and protected bicycle…
-

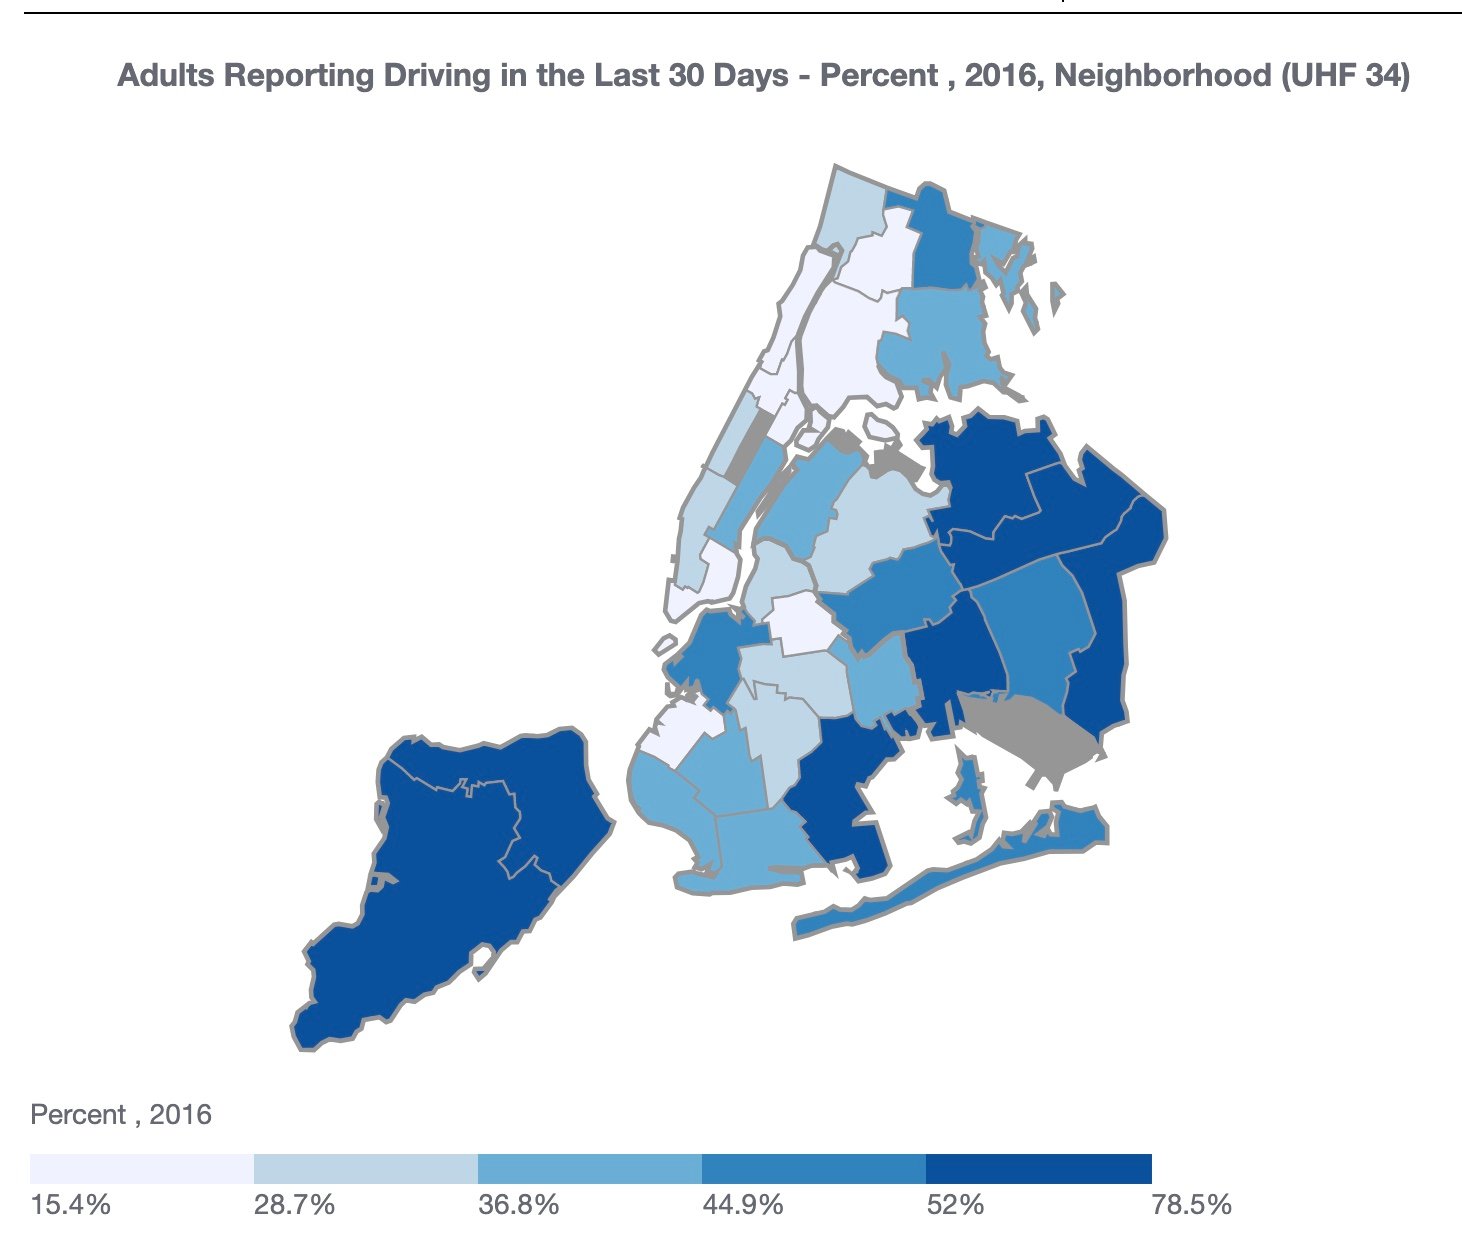
Drivers
How Calculated: Estimated percent of adults who reported driving in NYC in the last 30 days; expressed as a percent. Source: New York City Community Health Survey (CHS) Jobs for Youth Summer Camp jobs available: NewYorkEdge.org/Careers
-

Hispanic/Black/White/Asian
One of our neighbors took data derived from the census.gov 5-year American Community Survey data year ending 2013 and created 4 choropleth maps for Manhattan. Taking a look, can you tell which one represents the density of Black, White, Hispanic, or Asian Manhattanites? Although the map designer did note that some of the data is clearly ‘off’…
-

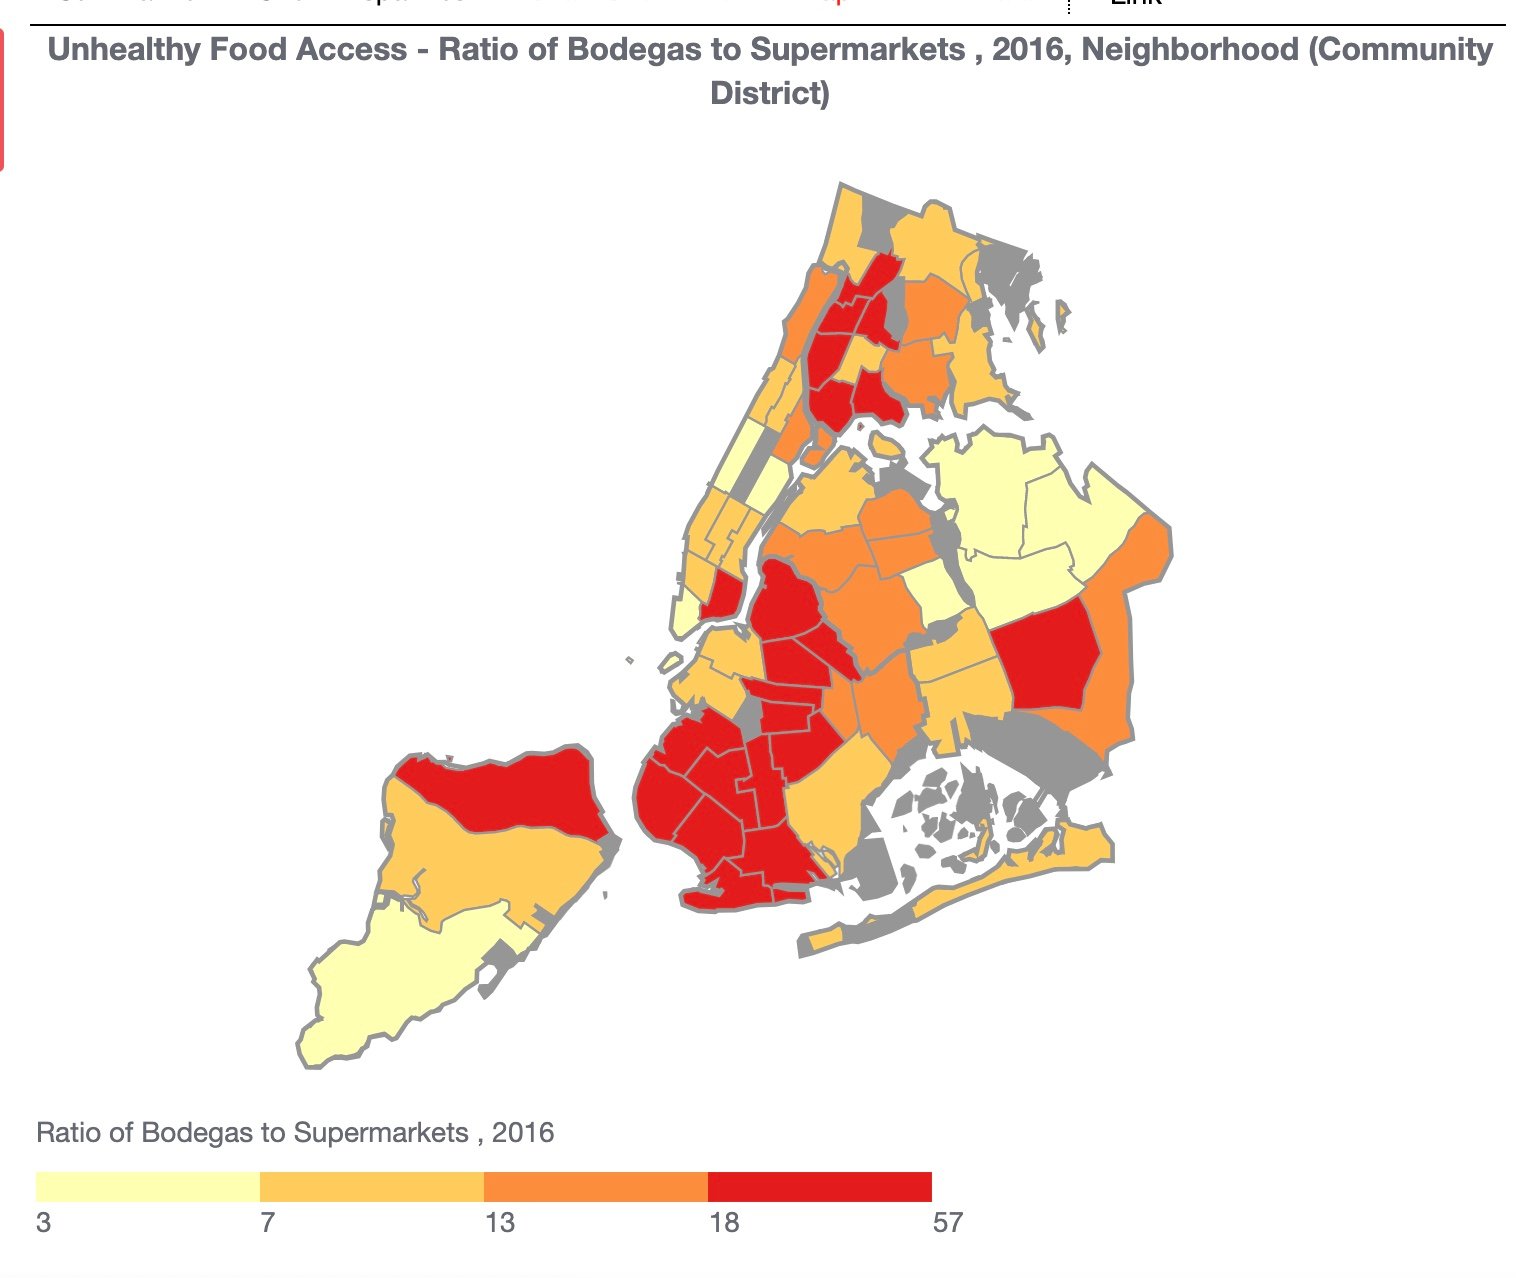
Unhealthy Food Access – The Ratio of Bodegas to Supermarkets
Ah, the bodega… The number of bodegas per supermarket within an area based on address of business. Bodegas are defined as food purchasing establishments with less than 4,000 square foot and excludes specialty stores, such as bakeries and vitamin stores. Supermarkets are defined as retail food purchasing establishments with greater than or equal to 10,000…
-

Tree Cover
The number of trees and the area shaded by them influences many neighborhood factors, such as attractiveness and lower summer temperatures that, in turn, encourage residents and visitors to walk and do other physical activity. “Tree canopy cover” measures the percent of a neighborhood that is covered (or shaded) by trees. About the Measure Tree…
-

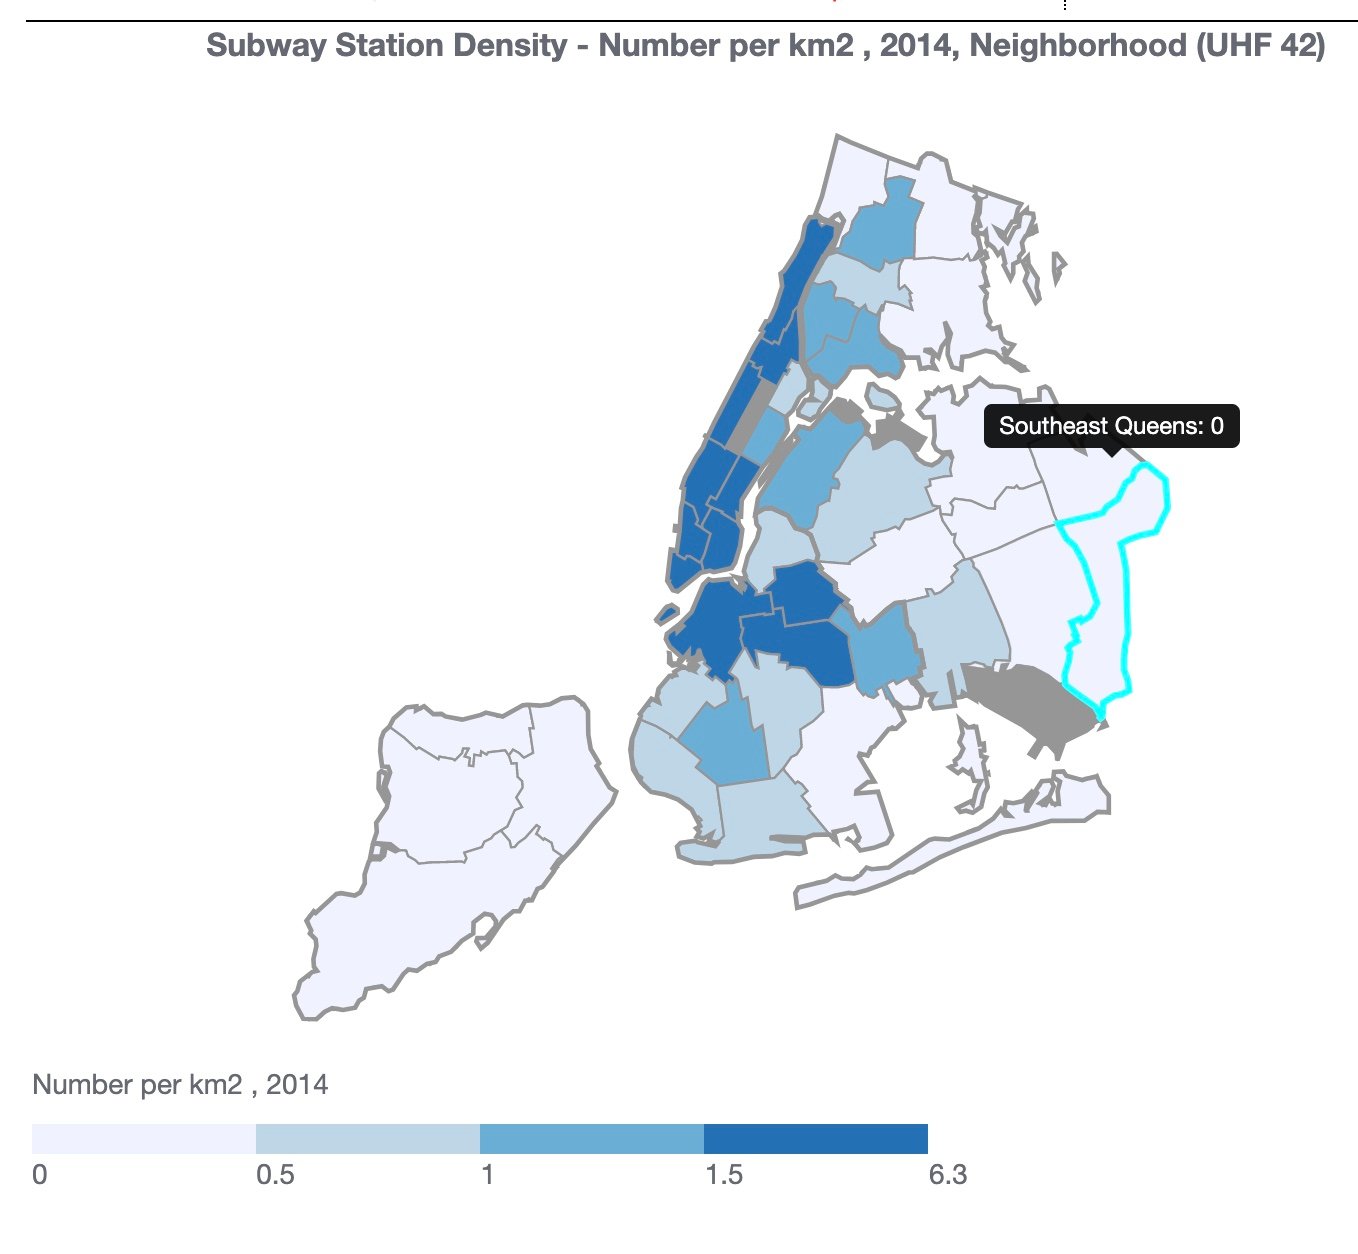
Subway Station Density
Many New Yorkers rely on the subway as their primary mode of transportation. Neighborhoods with greater subway access tend to have more foot traffic, making surrounding real estate highly desirable for residents and business. Subway use encourages active transportation (walking, biking), which improves the health of residents. About the Measure Subway Station Density – Number…
-

Free String Jazz Concert, Saturday
The Harlem Rose Garden is delighted to offer you another performance in the garden this Saturday at 2PM. 6 E 129th St, New York, NY 10035 Judith Insell / Joe Fonda Duo – Dark Wood Explorations Project Chamber jazz dominated by the dark, rich tones of the viola and bass as played by the Judith Insell / Joe Fonda…
-

Pop-up Vaccinations Today and Friday
Cayuga will be hosting a pop-up COVID vaccine clinic at our location on Third ave location. Here are the details: When: Thursday 05/06 and Friday 05/07 When: 8:30 am – 5:30 pm Where: Cayuga Centers (2183 Third Ave, New York, NY 10035) Brand: ModernaWalk-ins will be accepted on a limited basis. If interested in being vaccinated…
-

The Geography and Enrollment of Child Care Programs
Here is a quick map of child care programs in our community. The dots are sized according to the enrollment. Zoom in for more detail, and hover over any of the dots. https://datawrapper.dwcdn.net/4ODu0/1/ The John Lewis Day of Action! Join the Voter Awareness March in Harlem on Saturday, May 8th at 2:00 PM. March from…
-

The Public Health Impacts of PM2.5
The Department of Health and Mental Hygene (DoHMH) has an interesting set of maps showing which communities are most impacted by small particulate matter – PM2.5 – which comes from burning/exhaust. Fine particulate matter (PM2.5) are tiny airborne solid and liquid particles less than 2.5 microns in diameter. PM2.5 in NYC comes from inside and…
-

DHS
As a part of a FOIL request I recently sent to the Department of Homeless Services (DHS), I was given a map illustrating the number of buildings (466 in total) in which DHS provides shelter and services (as of January 31, 2021). The sidebar, next to the map, claims that there were 31% fewer buildings…
-
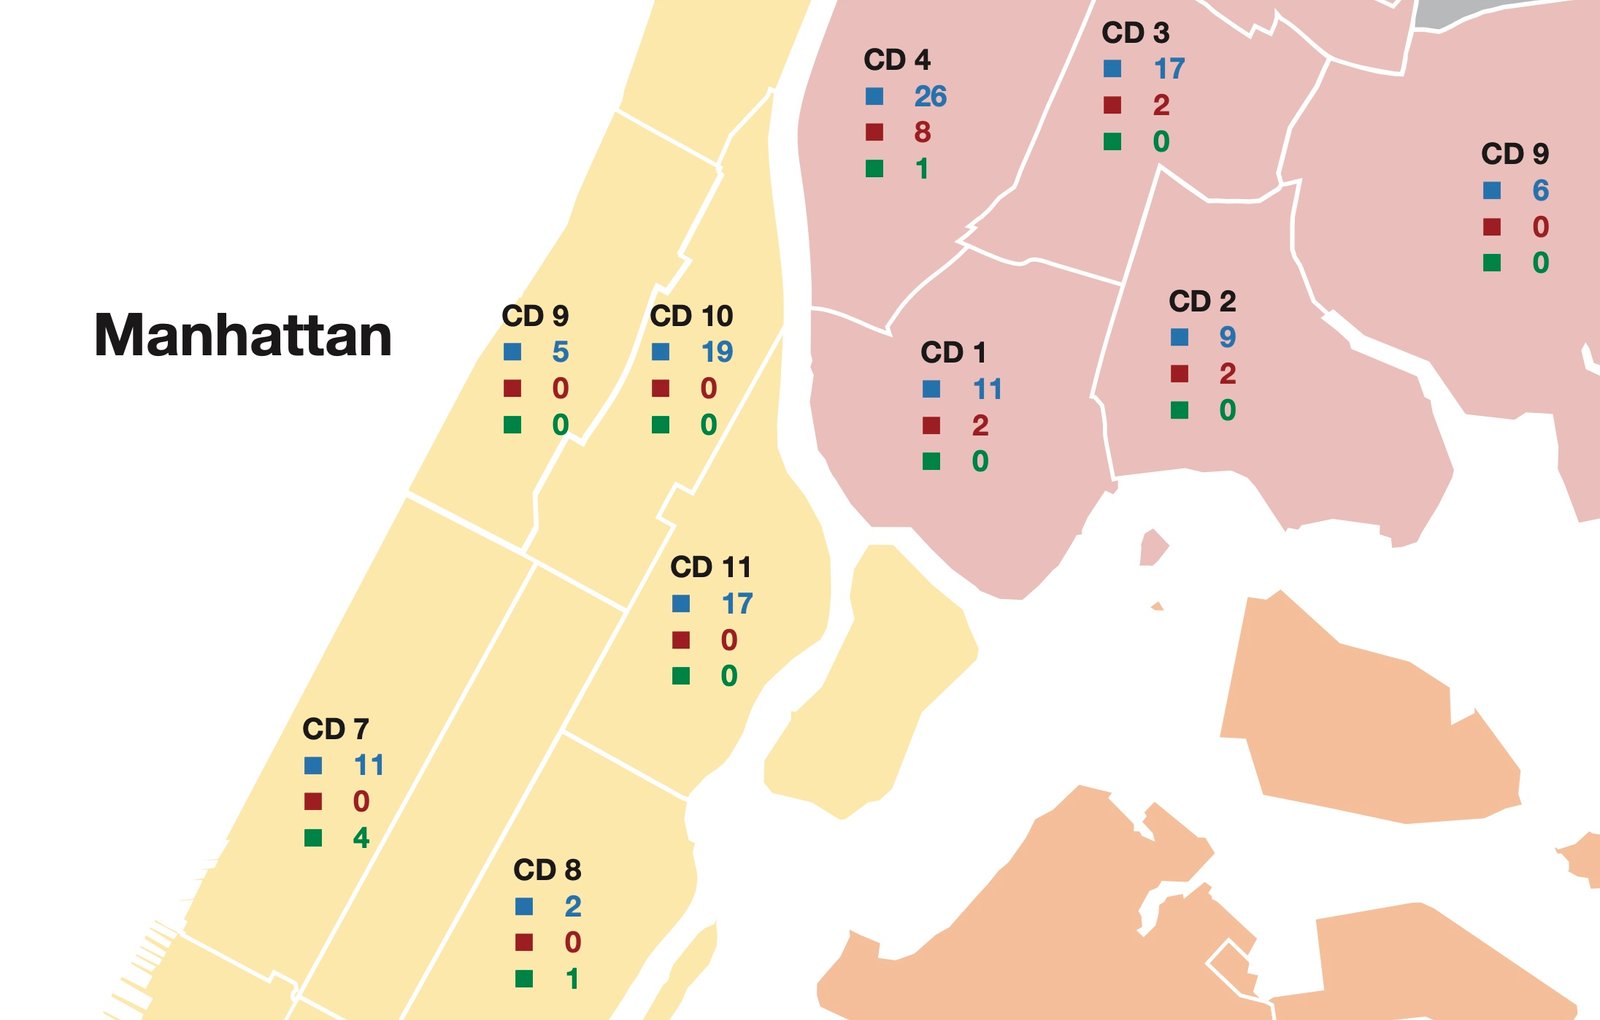
Community Districts
East Harlem has many commonalities with the South Bronx in terms of population, history, infrastructure, and governmental relations. A map of the density of opioid treatment programs (as licensed by OASAS) shows the clear linkage. Note how CB11 (East Harlem) has the largest opioid capacity in New York City. OASAS has packed programs in East…